A geological map shows the distribution of rocks exposed at or near the surface, along with structures such as faults and folds. Colours distinguish units; lines, symbols and notes describe their boundaries, orientation or relationships. A geological cross-section extends this reading below ground as an interpreted model.
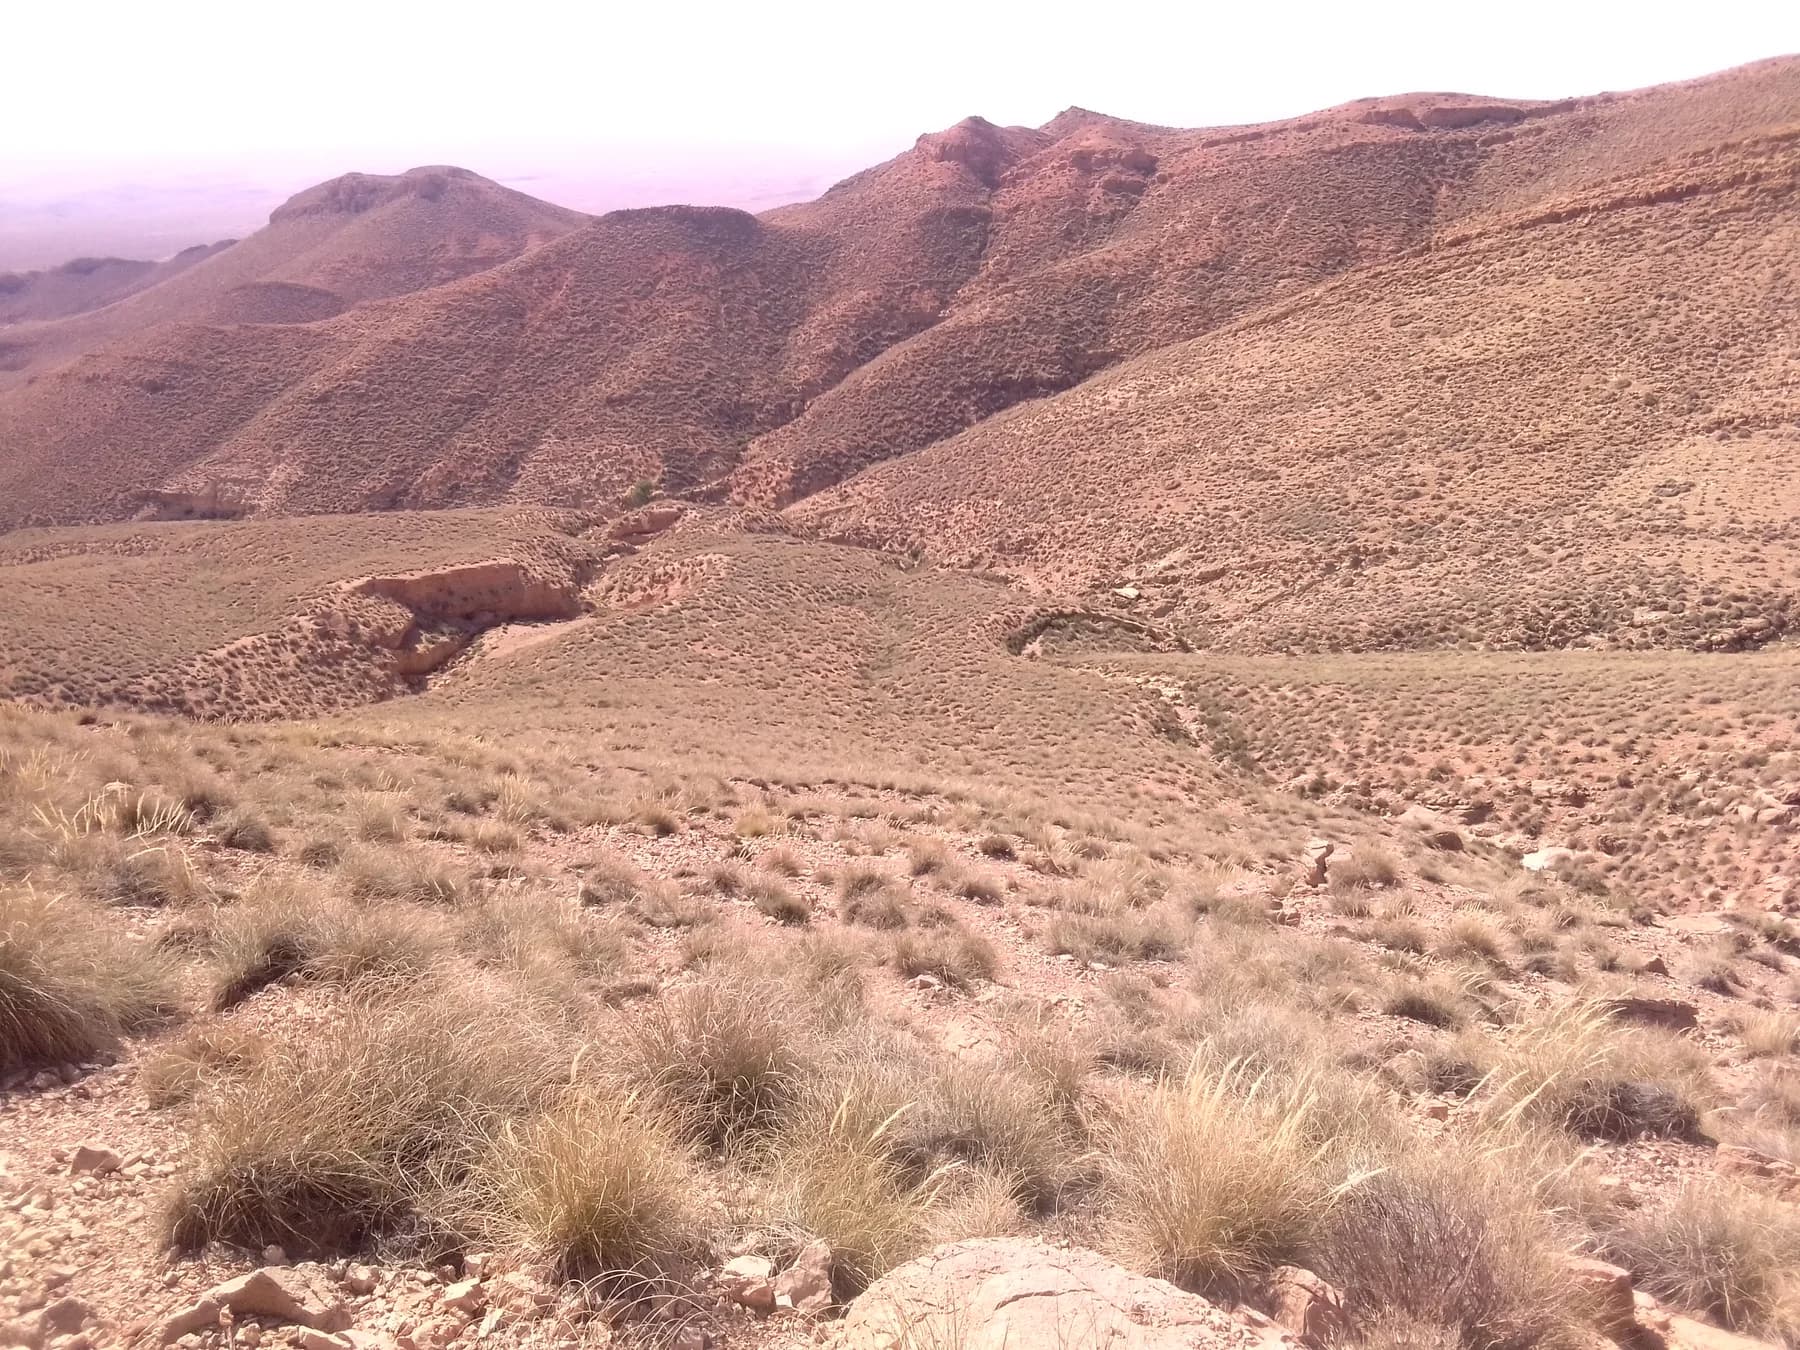
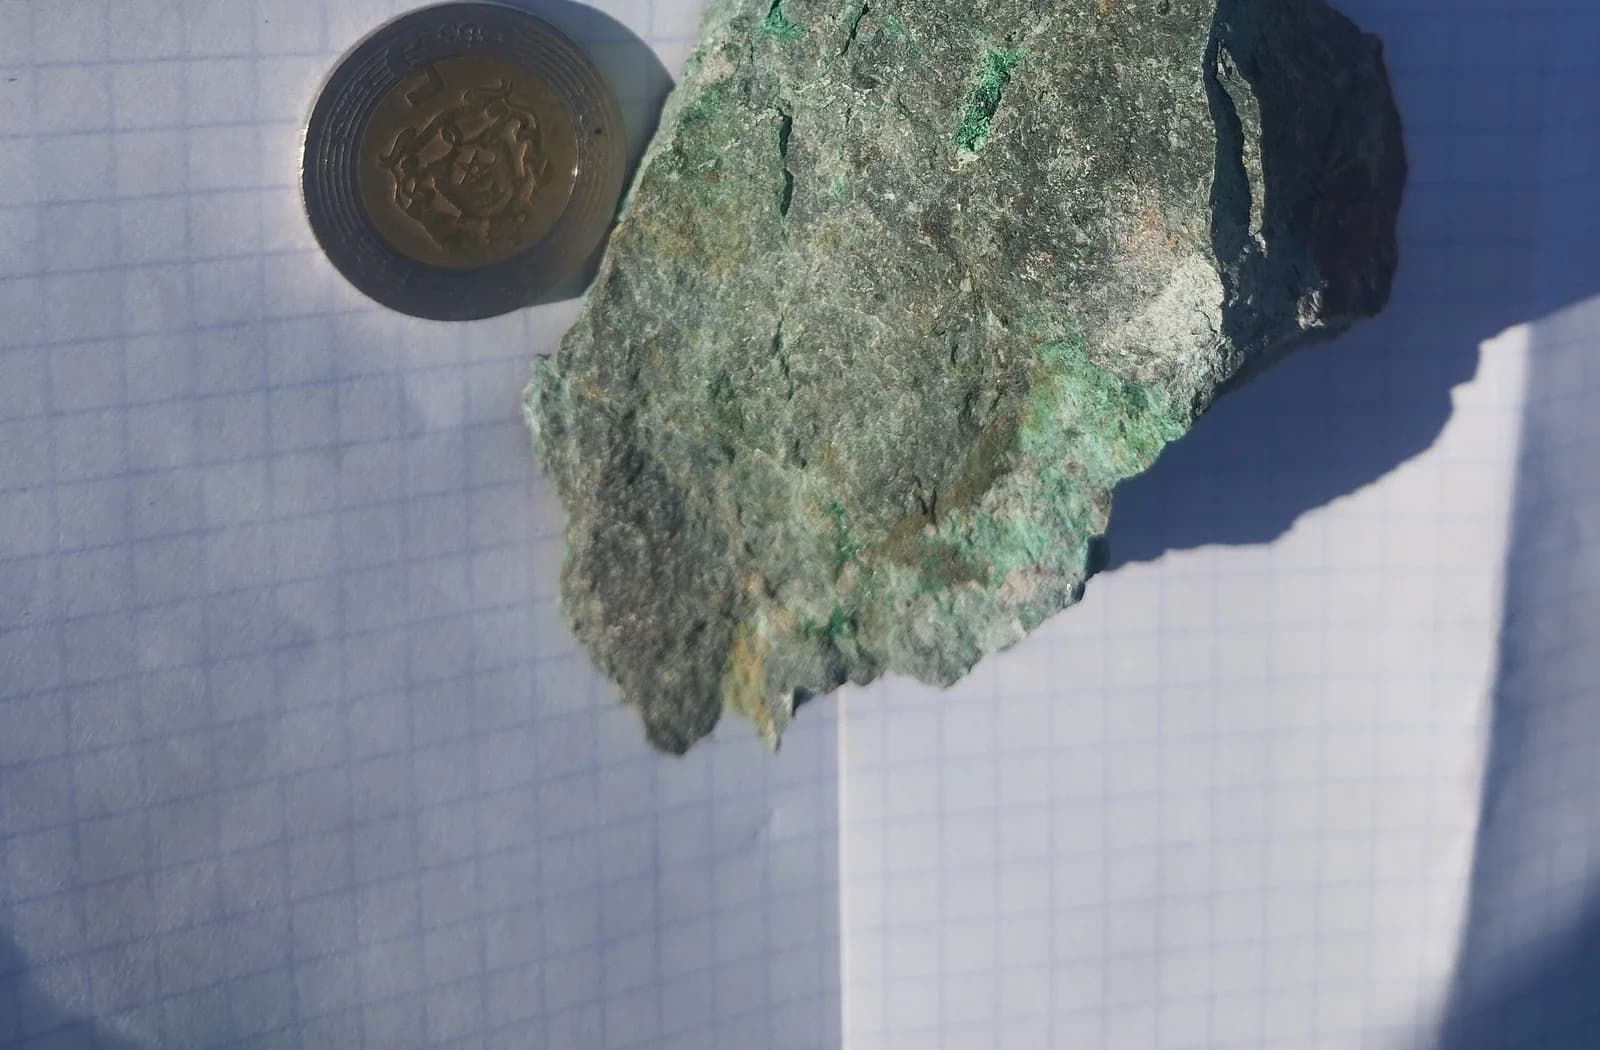
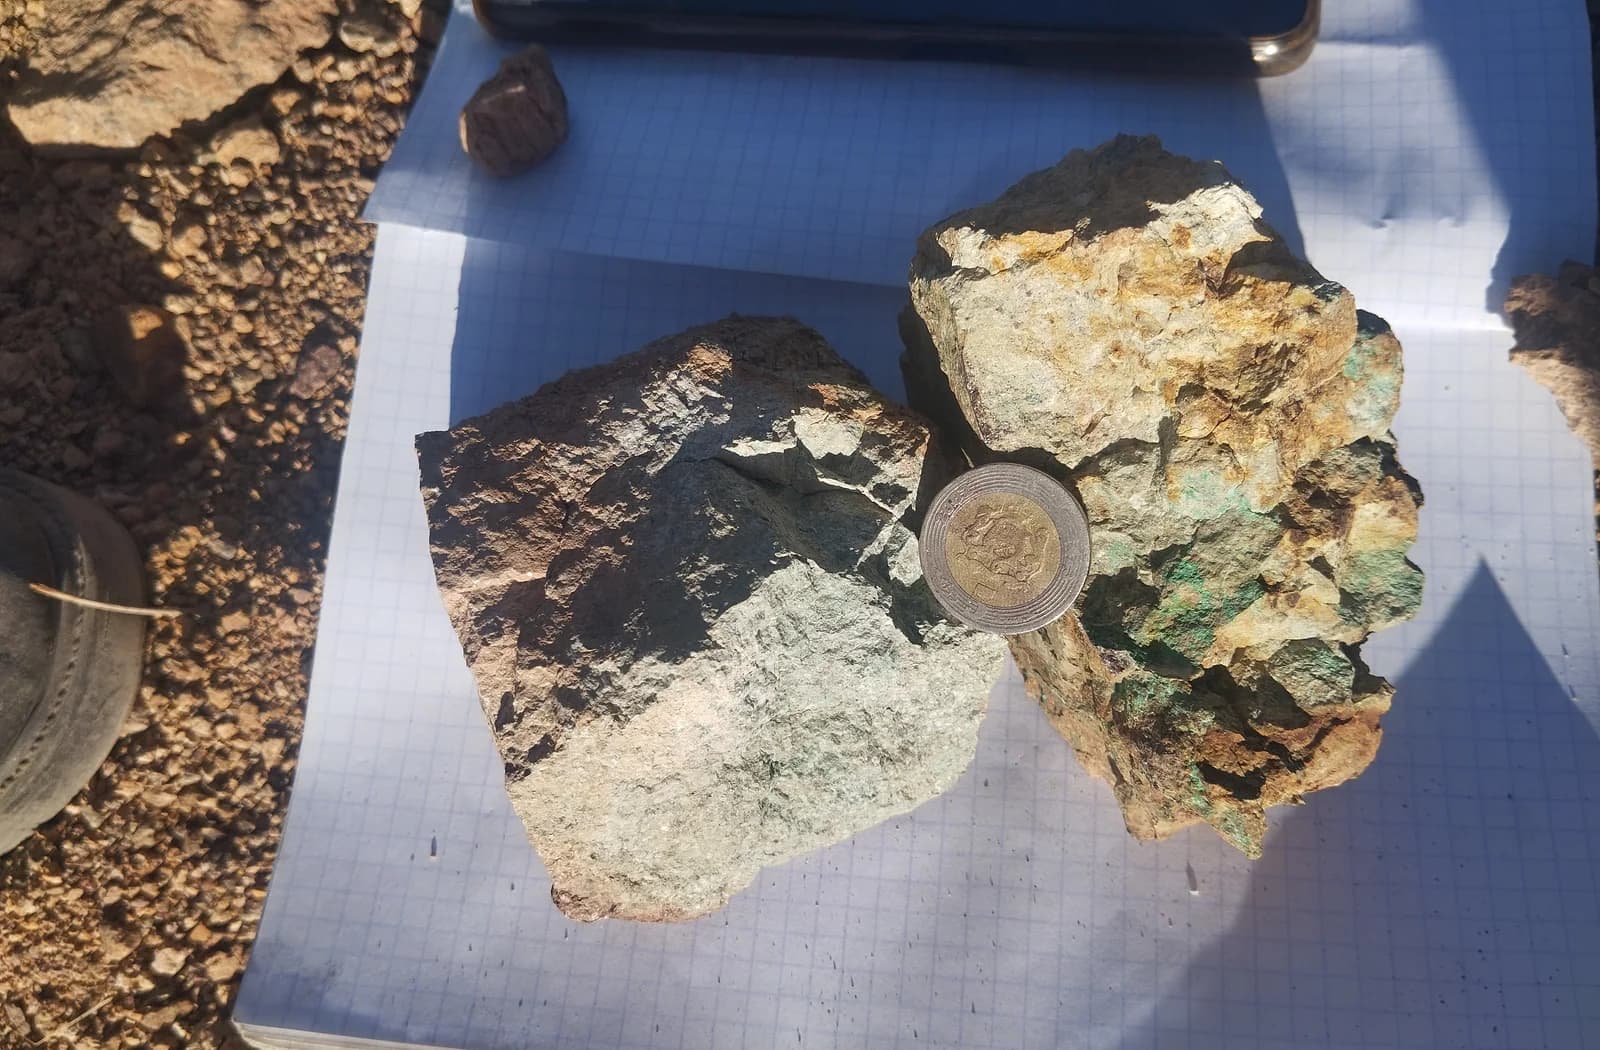
A map draws on existing data, outcrop observations and measurements recorded in field notes. Satellite imagery and terrain models help plan surveys and provide spatial continuity, but they cannot replace identifying rocks directly or checking boundaries in the field.
Scale sets the level of detail a map can show. Outcrop coverage, terrain, the quality of the base map and time spent surveying also affect confidence in each line. Read the legend, sources and date before using a map for a technical decision.